
The Problem with Multi-Cluster Observability
Observability is straightforward with one Kubernetes cluster. Deploy Prometheus, Grafana, maybe Loki, and the shape is clear. The complexity starts when you add environments: a management cluster for platform tooling, test, staging, and eventually production.
At that point, you have two options: run a full observability stack in every cluster, or centralize storage and ship telemetry. The first option is easy to reason about but expensive to operate: duplicated storage, multiple Grafana instances, and fragmented context when investigating incidents. Centralization takes more setup, but it scales better.
I run four clusters. I chose to centralize.
The Architecture
One cluster runs the observability backends. The others run collection agents and ship telemetry outward.
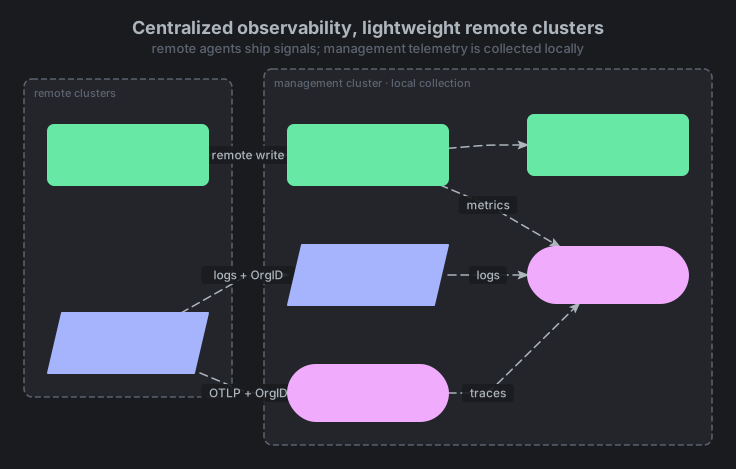
Metrics, logs, and traces stay separate at the storage layer but converge in one Grafana.
Metrics: VictoriaMetrics
For metrics, I chose VictoriaMetrics instead of Prometheus with Thanos or Mimir:
Single binary. VMSingle handles ingestion, storage, and queries in one process. There are no ingesters, store gateways, compactors, or object storage buckets to wire together. At this scale, operational simplicity matters more than horizontal scalability.
Remote write is first-class. Each remote cluster runs VMAgent, collects metrics locally, and remote-writes to VMSingle. VMAgent adds a cluster=<env> external label before shipping, so data remains attributable after it lands in the central backend.
Alerting stays centralized. VMAlert and VMAlertmanager run only on the management cluster. Because all metrics flow into the same VMSingle, alerting rules do not need to be replicated per environment.
The VictoriaMetrics Operator deploys separately before the main stack, which makes CRDs like VMServiceScrape available for service discovery without relying on prometheus.io/scrape annotations.
Logs: Loki
For logs, I use Loki. Loki’s multi-tenancy model fits this architecture well: each cluster maps to a tenant, and the X-Scope-OrgID header keeps writes isolated.
Grafana Alloy runs as a DaemonSet, collects pod logs through the Kubernetes API, and pushes them to Loki with the appropriate tenant header. In Grafana, each environment gets its own Loki datasource, such as Loki (test) or Loki (stage), so environment selection happens at the datasource level instead of through repeated label filters.
To control storage growth, Alloy drops DEBUG and INFO logs before shipping. WARN and ERROR are retained. Particularly noisy system namespaces get additional 50% sampling. This policy is intentionally aggressive and should be tuned to your storage and debugging needs.
Traces: Tempo
For traces, I use Tempo with the same tenancy pattern as Loki. Tempo runs centrally with multi-tenancy enabled. Alloy receives OTLP traces from applications and forwards them with the cluster tenant ID.
The Grafana integration is the payoff: each Tempo datasource uses tracesToLogs to point at the matching Loki datasource. A trace from test links directly to test logs, so cross-signal correlation works without manual tenant switching.
What I Tried and Dropped
VictoriaMetrics also has logs and traces products: VictoriaLogs and VictoriaTraces. I scaffolded both and got them partially working. The appeal was clear: one vendor stack, one set of CRDs, consistent APIs.
At the time, both were still early. VictoriaTraces was at v0.0.3, with no multi-tenancy, limited Grafana datasource support, and no trace-to-logs correlation. VictoriaLogs had more momentum, but query semantics and the Grafana plugin still felt immature.
Loki and Tempo are mature, well-integrated with Grafana, and well-documented. Their multi-tenancy model is proven. I kept the VictoriaLogs and VictoriaTraces configuration commented out in the repo, so switching remains straightforward if they mature enough to justify a single-stack approach.
The GitOps Side
Everything is managed with ArgoCD ApplicationSets. Each component follows the same pattern:
- One ApplicationSet per tool (
victoria-metrics-k8s-stack,loki,tempo,alloy) - A list generator with one element per environment
- Base values for shared config, per-environment overrides to enable or disable components
For example, vmsingle.enabled: false in the test, stage, and prod values files prevents VMSingle from deploying outside the management cluster. VMAgent still deploys and gets its remote-write URL from the environment override.
Renovate tracks chart version updates automatically via comments like:
# renovate: registryUrl=https://victoriametrics.github.io/helm-charts/ depName=victoria-metrics-k8s-stack
targetRevision: 0.84.0
When a new chart version is released, Renovate opens a PR. No manual version tracking.
What the Result Looks Like
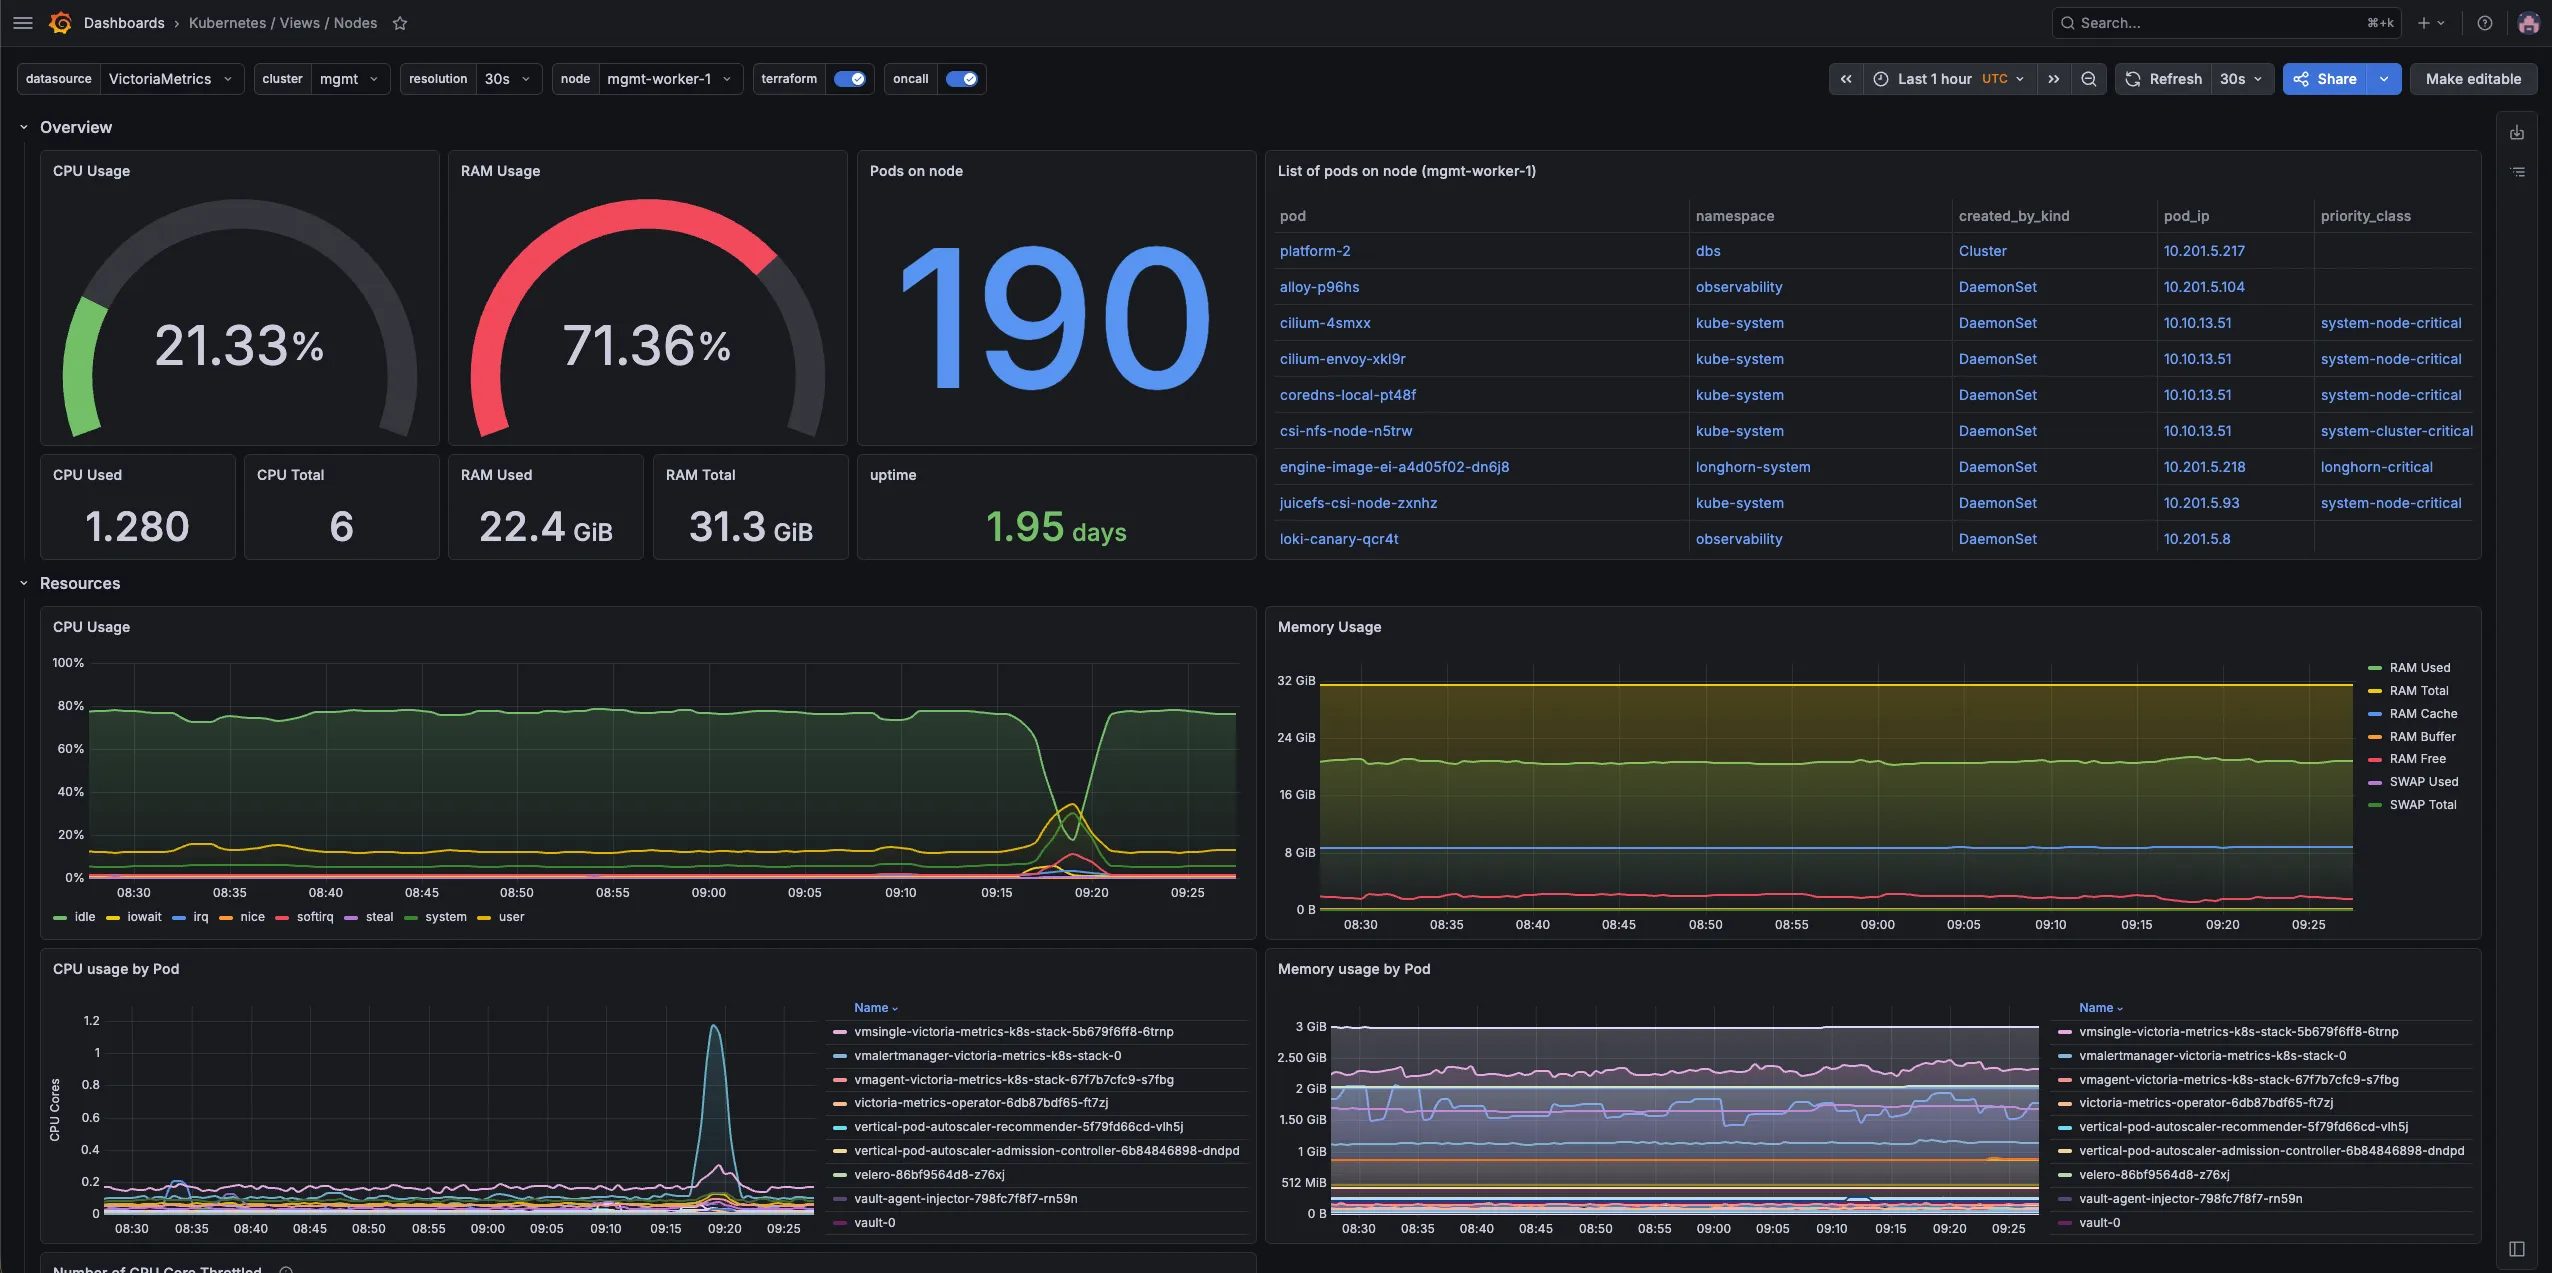
The result is one Grafana across four clusters. Dashboards can filter by cluster, traces link to matching logs, and alert rules are defined once against centralized metrics.
The management cluster runs the backends. Every other cluster runs VMAgent for metrics and Alloy for logs and traces. The agents are lightweight, especially compared with running a full Prometheus per cluster.
The stack is open source and self-hosted, with no SaaS dependency and no telemetry leaving the infrastructure.